Parametric Graphing Calculator
2025-12-03
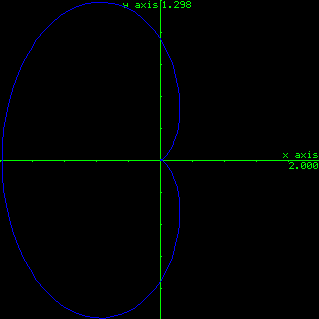
A simple graphing calculator which plots parametric equations of the form x(t) and y(t). The plot area is automatically scaled to fit the plot while remaining centred at the origin. Hitting Ctrl-p saves a screenshot named "graph.bmp", if one exists it increments the filename.
/*
  Graphing calculator for parametric equations
  Use ctrl-p to save a screenshot
*/
option explicit
option angle degrees

'initialize vectors
const MAXPTS = 100
dim float x(MAXPTS)
dim float y(MAXPTS)

'input functions
dim string funx$
dim string funy$
dim float tmin : dim float tmax

'set listener for keypress
on KEY keypress

ask:
cls
line input "x(t)="; funx$
line input "y(t)="; funy$
input "t range (min,max)"; tmin,tmax

cls
draw_axes 10
draw_fun funx$, funy$, tmin, tmax
pause 60000 'pause for a while
end

sub keypress
 local a$ as string
 a$ = inkey$
 select case asc(a$)
 case 16 'ctrl-p for print screen
  local fname$ as string
  fname$ = "graph"
  check_file fname$
  save Image fname$
 case else
  goto Ask
 end select
end sub

sub check_file fn$ as string
local string f$ = dir$(fn$+"*",FILE)
local string ext = ".bmp"
local integer i = 0
do while f$ <> ""
 inc i
 f$ = dir$()
loop

if i > 0 then
 fn$ = fn$+"-"+format$(i)+ext
else
 fn$ = fn$+ext
end if
end sub

sub fill_points funx$, funy$, numpts,   tmin, tmax
 local integer n = numpts
 local float max.x = 0.0
 local float max.y = 0.0

 'generate points
 local float min.t = tmin
 local float max.t = tmax
 local float delta.t =   (max.t-min.t)/n
 local float t
 local integer i
 for i=0 to n-1
  t = delta.t*i + min.t

  x(i) = eval(funx$)
  if abs(x(i))>max.x then   max.x=abs(x(i))

  y(i) = eval(funy$)
  if abs(y(i))>max.y then   max.y=abs(y(i))
 next i

 'catch null graphs
 if max.x = 0 then max.x = 1
 if max.y = 0 then max.y = 1

 'add scale
 x(n) = max.x
 y(n) = max.y
end sub

sub draw_axes numticks
 local integer mcount = numticks

 'draw axes
 local integer xaxis, yaxis
 xaxis = MM.VRES\2
 line 0,xaxis,MM.HRES,xaxis,, rgb(green)
 text MM.HRES-1,xaxis-1,"x axis", "RB",7

 yaxis = MM.HRES\2
 line yaxis,0,yaxis,MM.VRES,, rgb(green)
 text yaxis-1,1,"y axis","RT",7

 'draw ticks
 local integer i
 local float dx, dy
 dx = MM.HRES/mcount
 dy = MM.VRES/mcount
 for i=0 to mcount
  pixel yaxis+1,int(i*dy),rgb(green)
  pixel int(i*dx),xaxis+1,rgb(green)
 next i
end sub

sub draw_fun funx$, funy$, tmin, tmax
 local integer i
 local float nx.pt.x, nx.pt.y
 local float ls.pt.x, ls.pt.y

 'load plotting arrays
 fill_points funx$,funy$,MAXPTS,tmin, tmax
 local float max.x = x(MAXPTS)
 local float max.y = y(MAXPTS)

 'scale plot
 local float o.x = MM.HRES/2
 local float o.y = MM.VRES/2
 local float scl.x = (o.x-2)/max.x
 local float scl.y = (o.y-2)/max.y

 text MM.HRES-1,int(o.y+2), str$(max.x,0,3),"RT",7
 text int(o.x+2),1,str$(max.y,0,3), "LT",7

 'draw parametric equations
 ls.pt.x = scl.x*x(0) + o.x
 ls.pt.y = o.y - scl.y*y(0)

 for i=1 to (MAXPTS-1)
  nx.pt.x = scl.x*x(i) + o.x
  nx.pt.y = o.y - scl.y*y(i)

  line int(ls.pt.x),int(ls.pt.y), int(nx.pt.x),int(nx.pt.y),1,rgb(blue)

  ls.pt.x = nx.pt.x
  ls.pt.y = nx.pt.y

  pause 10
 next i
end sub